· Julian Blank · 7 min read
Domination: The Relation That Makes Multi-Objective Optimization Work
Before you can find a Pareto front, you need a way to compare solutions with multiple objectives. Domination is that comparison — and it's simpler than it sounds.
In single-objective optimization, comparing two solutions is trivial: whichever has the lower cost wins. With multiple objectives, this breaks down immediately.
Say solution A costs $100 and takes 5 hours. Solution B costs $80 and takes 7 hours. Which is better? It depends on how much you value time versus money — and that’s a human judgment, not a mathematical one.
Multi-objective optimization doesn’t try to make that judgment. Instead, it identifies solutions that are unambiguously worse than some other solution. The concept that formalizes this is domination.
The Definition
Solution dominates solution (written ) if and only if:
- is no worse than on every objective, and
- is strictly better than on at least one objective.
Both conditions must hold. If wins on one objective but loses on another, neither dominates the other — they are non-dominated with respect to each other.
This is deliberately conservative. Domination only fires when one solution is unambiguously better. No weights, no preferences, no collapse of multiple objectives into a single score.
Show code
import numpy as npimport matplotlib.pyplot as pltimport matplotlib.patches as mpatchesfrom matplotlib.patches import FancyArrowPatch
np.random.seed(7)plt.rcParams.update({ 'figure.dpi': 150, 'font.family': 'sans-serif', 'axes.spines.top': False, 'axes.spines.right': False,})Four Cases
Given two solutions in a two-objective minimization problem, there are exactly four possible relationships. The plot below shows all of them from the perspective of the gray reference point.
Show code
ref = np.array([5.0, 5.0])
cases = [ (np.array([3.0, 3.0]), '#16a34a', 'B dominates A\n(better on both)'), (np.array([7.0, 7.0]), '#dc2626', 'A dominates B\n(worse on both)'), (np.array([3.0, 7.0]), '#2563eb', 'Non-dominated\n(better f1, worse f2)'), (np.array([7.0, 3.0]), '#9333ea', 'Non-dominated\n(worse f1, better f2)'),]
fig, axes = plt.subplots(1, 4, figsize=(14, 3.5), layout='constrained')
for ax, (pt, color, label) in zip(axes, cases): ax.scatter(*ref, color='#64748b', s=120, zorder=5, label='A (reference)') ax.scatter(*pt, color=color, s=120, zorder=5, marker='D', label='B') ax.annotate('A', ref, textcoords='offset points', xytext=(8, 4), fontsize=10, color='#64748b') ax.annotate('B', pt, textcoords='offset points', xytext=(8, 4), fontsize=10, color=color) ax.set_xlim(0, 10) ax.set_ylim(0, 10) ax.set_xlabel('f₁ (minimize)', fontsize=9) ax.set_ylabel('f₂ (minimize)', fontsize=9) ax.set_title(label, fontsize=9, color=color, fontweight='bold') ax.axvline(ref[0], color='#64748b', lw=0.8, linestyle='--', alpha=0.4) ax.axhline(ref[1], color='#64748b', lw=0.8, linestyle='--', alpha=0.4)
plt.suptitle('Domination cases relative to solution A', fontsize=11, fontweight='bold', y=1.02)plt.show()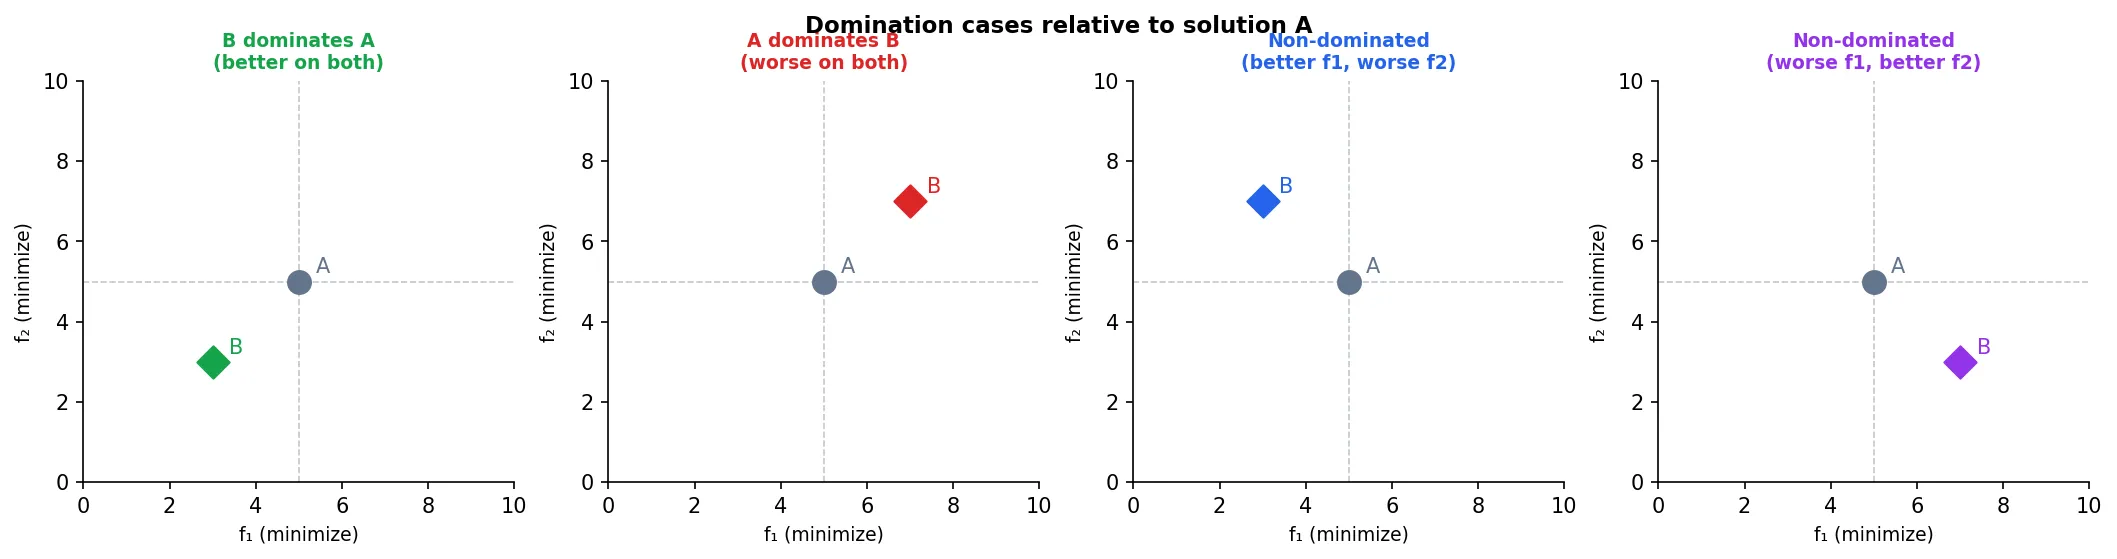
The dashed lines partition the objective space into four quadrants relative to A:
- Bottom-left: B dominates A — strictly better on both objectives.
- Top-right: A dominates B — A is strictly better on both.
- Bottom-right / Top-left: Neither dominates — one is better on f₁, the other on f₂.
The two non-dominated cases are exactly where value judgments are required. No algorithm can declare one solution better than the other without additional preference information.
Domination Depends on the Objective Direction
So far we’ve assumed both objectives are minimized. In practice, some objectives are maximized — profit, accuracy, coverage. The domination rule is the same, but the “better” direction flips.
For a minimization objective, lower is better. For a maximization objective, higher is better. The four combinations:
Show code
ref = np.array([5.0, 5.0])b_pos = np.array([3.0, 3.0]) # always at same position; arrows show what 'better' means
cases = [ ('min f₁, min f₂', [(-1, 0), (0, -1)], '#2563eb'), ('min f₁, max f₂', [(-1, 0), (0, +1)], '#16a34a'), ('max f₁, min f₂', [(+1, 0), (0, -1)], '#9333ea'), ('max f₁, max f₂', [(+1, 0), (0, +1)], '#dc2626'),]
fig, axes = plt.subplots(2, 2, figsize=(10, 8), layout='constrained')axes = axes.flatten()
for ax, (title, dirs, color) in zip(axes, cases): # Reference point A ax.scatter(*ref, color='#64748b', s=120, zorder=5) ax.annotate('A', ref, textcoords='offset points', xytext=(6, 4), fontsize=11, color='#64748b', fontweight='bold')
# Shade the domination region (where B must lie to dominate A) dx, dy = dirs[0][0], dirs[1][1] x0 = ref[0] if dx < 0 else 0 x1 = ref[0] if dx > 0 else 10 y0 = ref[1] if dy < 0 else 0 y1 = ref[1] if dy > 0 else 10 # Strict dominance region (excluding the ref lines themselves) ax.fill_between([x0, x1], [y0, y0], [y1, y1], color=color, alpha=0.12, zorder=1)
# Example dominating point B bx = ref[0] - 1.8 * dx by = ref[1] - 1.8 * dy ax.scatter(bx, by, color=color, s=120, zorder=5, marker='D') ax.annotate('B (dominates A)', (bx, by), textcoords='offset points', xytext=(6, 4), fontsize=9, color=color)
# Crosshair through A ax.axvline(ref[0], color='#64748b', lw=0.8, linestyle='--', alpha=0.5) ax.axhline(ref[1], color='#64748b', lw=0.8, linestyle='--', alpha=0.5)
# Direction arrows on axes arrow_kw = dict(arrowstyle='->', color='#94a3b8', lw=1.2) if dx < 0: ax.annotate('', xy=(1, 0.5), xytext=(9, 0.5), arrowprops=arrow_kw) ax.text(0.5, 0.2, 'better →', fontsize=7, color='#94a3b8', rotation=0) else: ax.annotate('', xy=(9, 0.5), xytext=(1, 0.5), arrowprops=arrow_kw) ax.text(8, 0.2, '← better', fontsize=7, color='#94a3b8') if dy < 0: ax.annotate('', xy=(0.5, 1), xytext=(0.5, 9), arrowprops=arrow_kw) ax.text(0.1, 0.5, 'better', fontsize=7, color='#94a3b8', rotation=90) else: ax.annotate('', xy=(0.5, 9), xytext=(0.5, 1), arrowprops=arrow_kw) ax.text(0.1, 8, 'better', fontsize=7, color='#94a3b8', rotation=90)
ax.set_xlim(0, 10) ax.set_ylim(0, 10) ax.set_xlabel('f₁', fontsize=11) ax.set_ylabel('f₂', fontsize=11) ax.set_title(title, fontsize=11, fontweight='bold', color=color)
plt.suptitle('Domination region (shaded) depends on objective directions', fontsize=12, fontweight='bold')plt.show()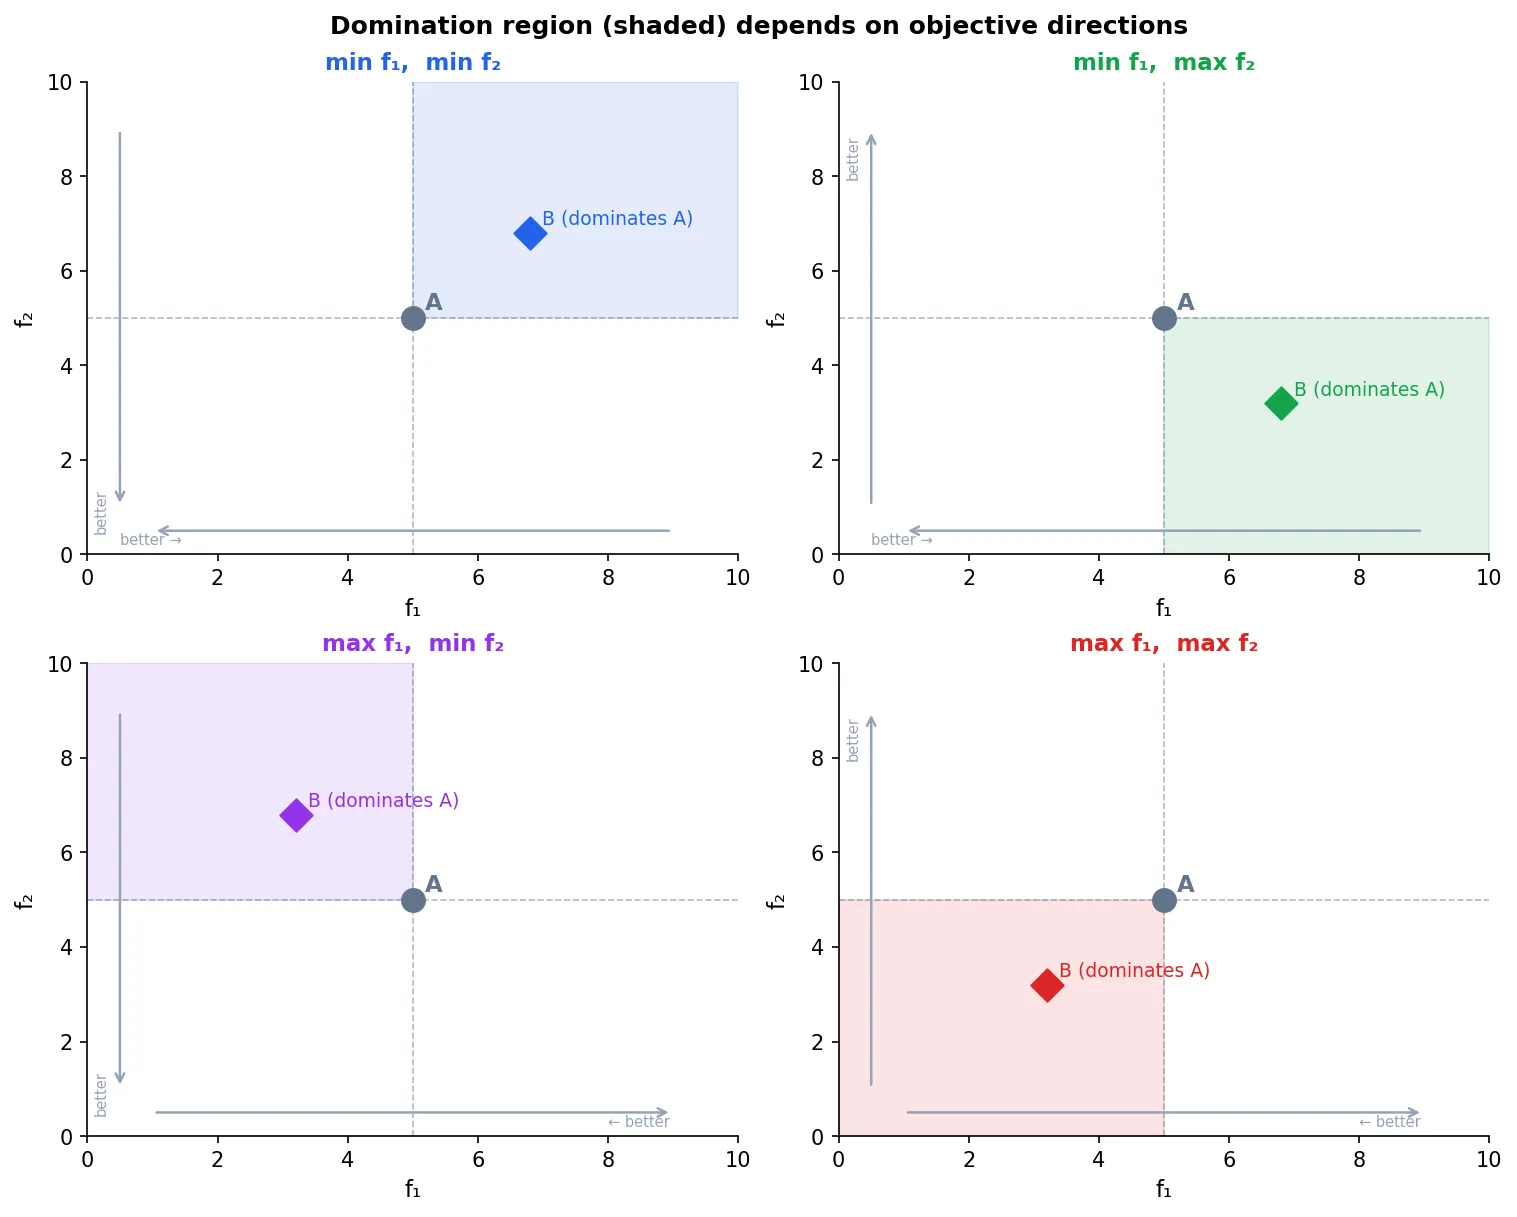
The shaded region shows where B must lie to dominate A. The reference point A sits at the corner — B needs to be strictly inside the shaded region on at least one axis and no worse on any other.
In code, the only change needed is flipping the comparison sign for maximized objectives:
# directions: -1 = minimize, +1 = maximizedef dominates(a, b, directions): # Convert to minimization: multiply by direction a_norm = a * directions b_norm = b * directions return np.all(a_norm <= b_norm) and np.any(a_norm < b_norm)Multiplying by the direction vector maps every maximization objective to minimization, so the standard domination check applies uniformly. Most multi-objective frameworks — including pymoo — handle this internally by convention (pymoo always minimizes; to maximize, negate the objective).
In a Population
With many solutions, we apply domination pairwise. A solution is non-dominated if no other solution in the population dominates it. The set of all non-dominated solutions is the Pareto front — the topic of the next post.
Here’s a population where each point is colored by whether it’s dominated or not.
Show code
def dominates(a, b): """Return True if a dominates b (minimization).""" return np.all(a <= b) and np.any(a < b)
def non_dominated_mask(costs): n = len(costs) dominated = np.zeros(n, dtype=bool) for i in range(n): for j in range(n): if i != j and dominates(costs[j], costs[i]): dominated[i] = True break return ~dominated
n = 60pop = np.random.rand(n, 2) * 10mask = non_dominated_mask(pop)
fig, ax = plt.subplots(figsize=(7, 5), layout='constrained')ax.scatter(pop[~mask, 0], pop[~mask, 1], color='#94a3b8', alpha=0.6, s=45, label='Dominated')ax.scatter(pop[mask, 0], pop[mask, 1], color='#2563eb', s=70, zorder=5, label='Non-dominated (Pareto front)')
front = pop[mask]front = front[front[:, 0].argsort()]ax.step(front[:, 0], front[:, 1], where='post', color='#2563eb', alpha=0.35, lw=1.5)
ax.set_xlabel('f₁ (minimize)', fontsize=12)ax.set_ylabel('f₂ (minimize)', fontsize=12)ax.set_title('Non-dominated solutions in a population', fontsize=13, fontweight='bold')ax.legend(frameon=False)plt.show()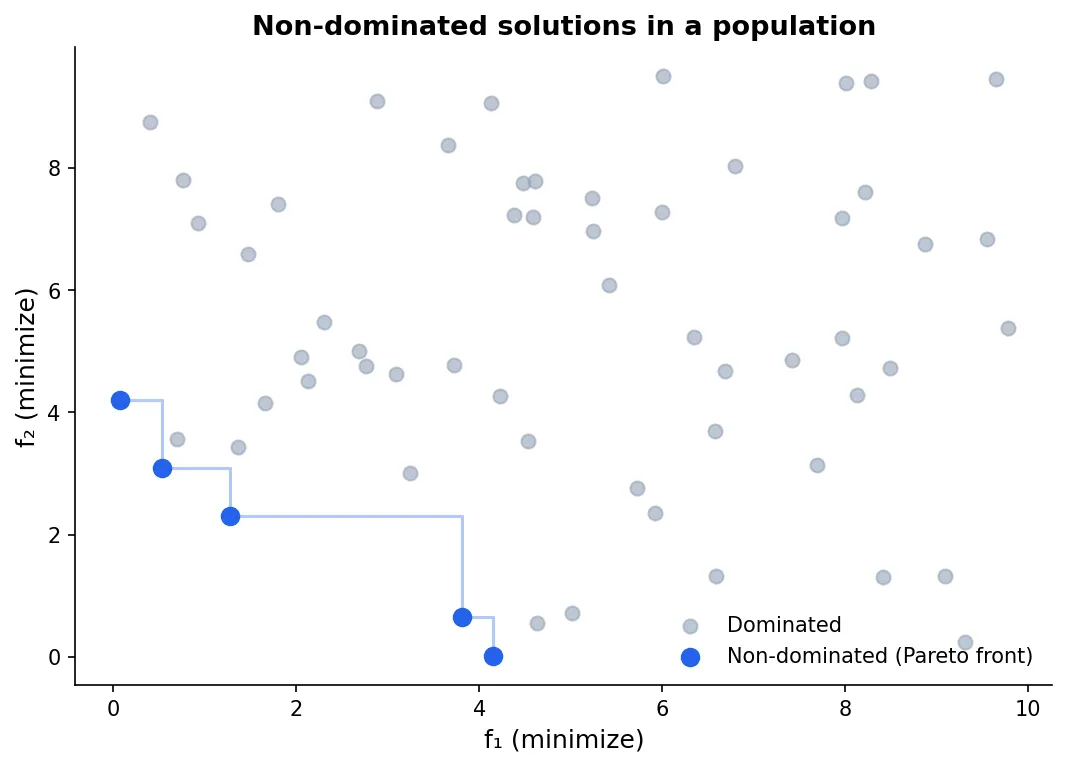
The Complexity Problem
The naive algorithm above is where is the population size and is the number of objectives. For small populations this is fine. For large or many objectives it becomes a bottleneck.
There are faster algorithms — the most well-known being the fast non-dominated sort from NSGA-II, which runs in worst case but organizes solutions into fronts (rank 1 = non-dominated, rank 2 = non-dominated after removing rank 1, and so on). This ranking is what drives selection in most evolutionary multi-objective algorithms.
There’s also a deeper issue: as the number of objectives grows, domination becomes less useful. In high dimensions, almost every solution is non-dominated with respect to every other — the front encompasses the entire population. This is the curse of dimensionality for multi-objective optimization, and it’s why algorithms for many-objective problems () need fundamentally different mechanisms beyond domination alone.
For two and three objectives, domination works well and the Pareto front is geometrically meaningful. That’s the regime where most practical problems live.
Summary
Domination is the foundational comparison relation in multi-objective optimization. It identifies when one solution is unambiguously better than another — without requiring weights or preference information. Solutions that no other solution dominates form the Pareto front.
The next post looks at the Pareto front itself: what it represents geometrically, how its shape encodes the structure of the trade-off, and what it means to “solve” a multi-objective problem.